Stat History Viewer
🧭 Overview
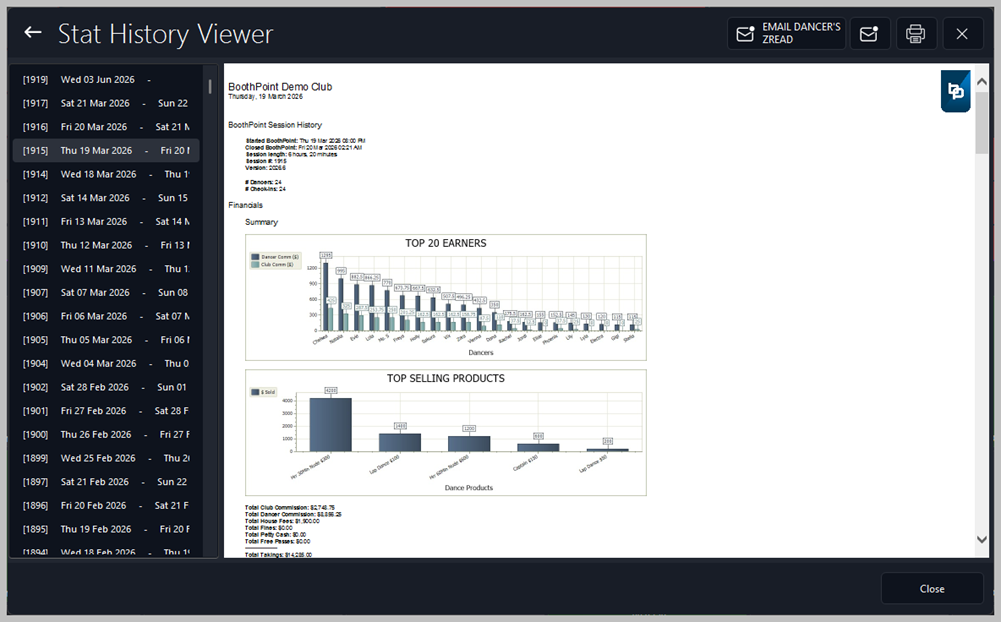
The Stat History Viewer provides a complete historical breakdown of past BoothPoint sessions. It allows management to review session activity, dancer performance, product sales, commissions, fees, and overall financial totals.
This screen is typically used by owners, auditors, and senior managers for compliance checks, performance reviews, and financial reporting.
📅 Session List (Left Panel)The left panel displays a chronological list of all past sessions.
Each entry shows:
Selecting a session loads its full statistical report on the right. 🧾 Session Summary (Right Panel)Club Name and DateDisplays the venue name and the date of the selected session. 🕒 BoothPoint Session HistoryThis section provides operational details about the selected session. Started BoothPointThe exact date and time the session was opened. Closed BoothPointThe exact date and time the session was closed. Session LengthTotal duration of the session, calculated automatically. VersionThe BoothPoint software version used during that session. # DancersNumber of dancers who checked in during the session. # Check‑insTotal number of check‑ins recorded. 💰 Financial SummaryThis section provides a high‑level financial breakdown for the session. Total Club CommissionTotal amount earned by the club from dancer commissions. Total Dancer CommissionTotal amount paid out to dancers. Total Booth FeesTotal booth fees collected from dancers. Total FinesTotal fines paid by dancers. Total Free PassesValue of free passes used during the session. Total TakingsOverall revenue generated during the session. 💵 Tender BreakdownShows how the takings were split by payment method. Total CashTotal amount received in cash. Total Credit CardsTotal amount received via card payments. 🛍️ Sales by Product TypesA breakdown of revenue grouped by product category. Total DancersNumber of dancer‑related sales and their total value. Total Tipping DollarsNumber of tipping dollar sales and their total value. Total Stage ShowNumber of stage show sales and their total value. Total House FeesNumber of house fee transactions and their total value. 🏆 Top 20 Earners (Chart)A bar chart showing the top 20 earning dancers for the session. Each bar typically represents:
This provides a quick visual ranking of dancer performance. 🥇 Top Selling Products (Chart)A bar chart showing the highest‑selling products for the session.
Each bar represents:
Useful for identifying popular products and sales trends. 💃 Dancer BreakdownA detailed list of every dancer who worked during the session.
For each dancer, the following fields are shown: Check‑InThe exact time the dancer checked in. Check‑OutThe exact time the dancer checked out. Total Session LengthHow long the dancer worked during the session. Total EarningsTotal amount earned by the dancer. Club CommissionAmount retained by the club from the dancer’s earnings. Dancer CommissionAmount paid to the dancer. House Fee Paid (Cash)House fee paid in cash. House Fee Paid (Free Pass)House fee covered by a free pass. Fines PaidAny fines paid by the dancer during the session. This section provides a complete financial and performance profile for each dancer. 🛠️ Actions Available |