🧭 Overview
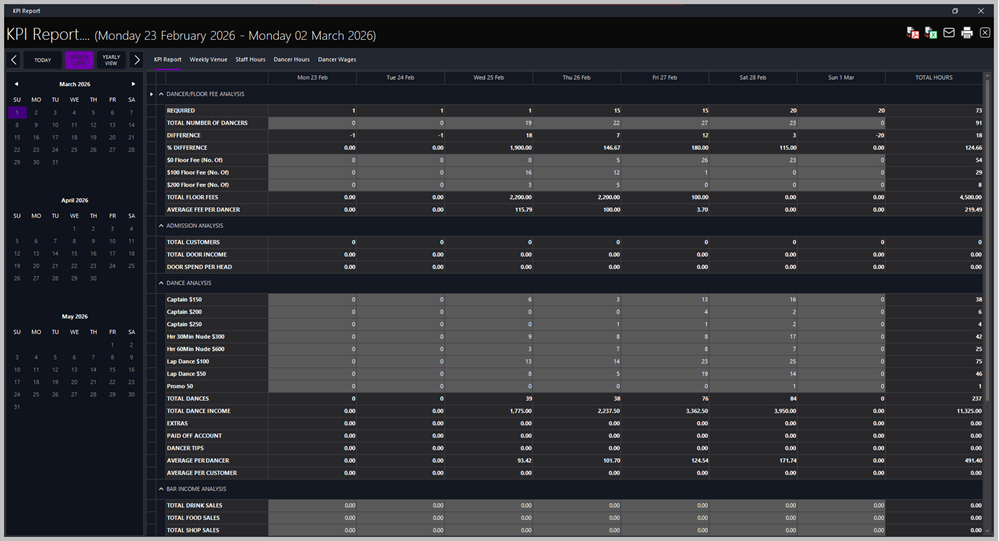
The KPI Report provides a weekly summary of key performance indicators across dancer activity, admissions, bar income, and payment types. Access it from Reports > Sales Analysis > KPI Sheet.
Use this report to monitor weekly totals, compare daily performance, and identify trends in dancer fees, dance income, and overall takings.
🗓️ Navigation
-
📅 Date Range (Top Header): Displays the selected week (e.g., Monday 16 March 2026 – Sunday 22 March 2026).
-
🗂️ Calendar (Left Panel): Select any week using the calendar. The active week is highlighted in purple.
-
🔘 View Buttons (Top Left):
-
Today – jumps to the current day.
-
Weekly View – shows the seven‑day KPI sheet.
-
Yearly View – displays annual totals for comparison.
Tabs along the top allow switching between related reports: KPI Report, Weekly Venue, Staff Hours, Dancer Hours, and Dancer Wages.
📈 Sections
💃 Dancer / Floor Fee Analysis
Shows dancer counts and floor‑fee breakdowns.
-
Required / Total Number of Dancers – expected vs. actual attendance.
-
Difference / % Difference – variance between required and actual.
-
$0 / $100 / $200 Floor Fee (No. Of) – number of dancers charged at each fee level.
-
Total Floor Fees – total fees collected.
-
Average Fee per Dancer – average fee across all dancers.
🚪 Admission Analysis
Tracks customer entries and door income.
-
Total Customers – number of paying customers.
-
Total Door Income – total door takings.
-
Door Spend per Head – average spend per customer.
🎶 Dance Analysis
Summarises all dance types and income.
-
Captain / Hr Nude / Lap Dance – counts per category.
-
Total Dances – total number performed.
-
Total Dance Income – combined income from all dances.
-
Extras / Paid Off Account / Dancer Tips – additional earnings.
-
Average per Dancer / Customer – performance averages.
🍸 Bar Income Analysis
Displays sales from drinks, food, and shop items.
💳 Payment Type Analysis
Breaks down payment methods.
-
Total PDQ Receipts – card transactions.
-
Credit Card Comm – commission deducted.
-
Total Cash / Total Tender – cash and combined totals.
-
Petty Cash / Fines – adjustments and deductions.
💰 Total Sales
Summarises overall takings.
-
Daily Takings – total for each day.
-
Week to Date – cumulative weekly total.
-
Average Spend / Head – average customer spend.
🧾 Top‑Right Action Buttons
-
📄 Export to PDF – generates a printable PDF version of the report.
-
📊 Export to Excel – exports all KPI data to an Excel spreadsheet for further analysis.
-
✉️ Email Report – sends the report directly to the HQ email address configured in system settings.
-
🖨️ Print Report – prints the current KPI sheet using the default printer.
|

|
Tips
-
Use Weekly View for operational reviews and Yearly View for trend analysis.
-
Ensure all dancer and POS data are entered before running the report to avoid zero totals.
-
Export regularly for archival or HQ submission.
|
|