Reports Overview
|
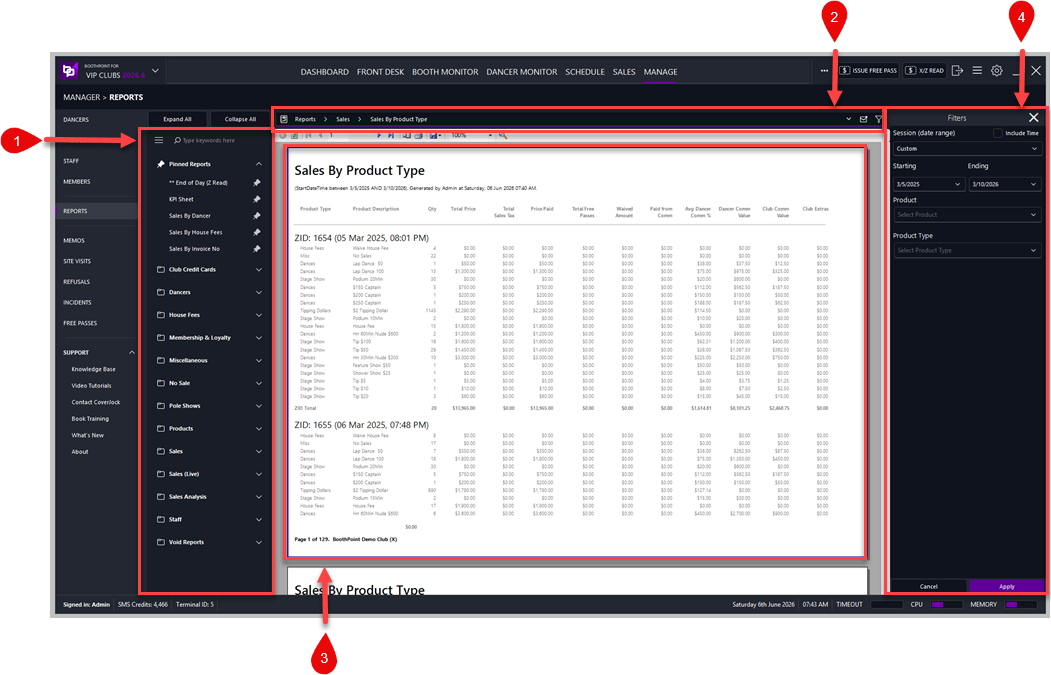
The Reports section in BoothPoint provides detailed insights into club operations, sales, and performance. It allows managers to generate, view, and share reports for dancers, staff, terminals, and products — all from one centralized location.
🗔 Main LayoutThe Reports screen is divided into four key areas:
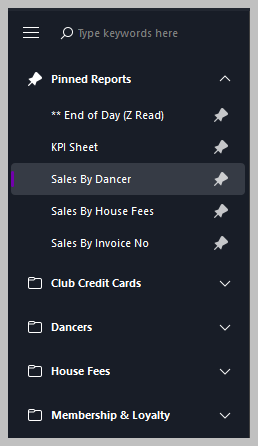
📚 1. Navigation SidebarLocated on the left side of the screen, the sidebar organizes all available reports into categories for quick access.
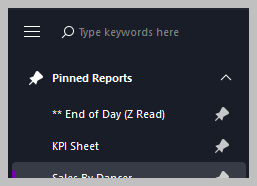
Pinned Reports
Pinned reports appear at the top of the list with a pin icon 📌. These are frequently used reports that remain easily accessible regardless of category. To pin or unpin a report:
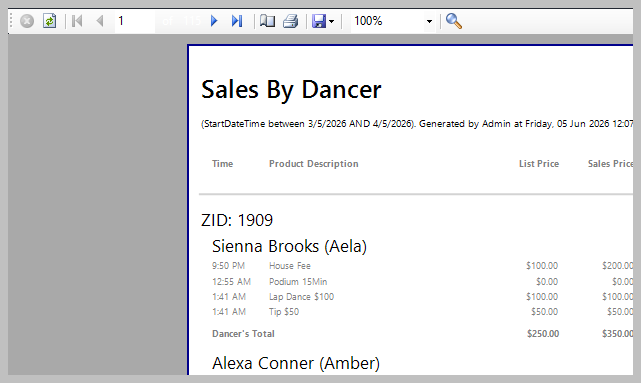
📊 2. Report Viewer
The central area displays the selected report in full detail. Reports can include columns for:
Each report is automatically generated with a header showing:
Example: Sales By Dancer (StartDateTime between 6/3/2025 and 6/4/2025, Generated by Admin at Wednesday, June 9, 2026, 03:47 PM). 🛠️ 3. Top Toolbar
Located at the top right of the Reports screen, the toolbar provides tools for searching, filtering, and emailing reports.
Search
Use the search bar to quickly locate reports by keyword. Type part of a report name (e.g., “Sales,” “Dancer,” or “Z‑Read”) to instantly narrow results.
Filter
The filter icon opens the Filter Panel (see below) for refining report data by date range, dancer, or product type.
The email icon enables direct sharing of reports from BoothPoint. Click the icon to open the email dialog, then:
This feature is ideal for sending daily summaries to management or accounting teams.
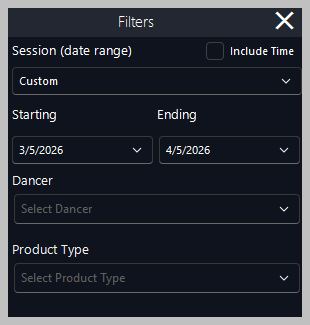
🔍 4. Filter Panel
Located on the right side of the screen, the Filter Panel allows precise control over report data before generating or exporting.
Sample Filter Options
Controls
Filters can be combined to produce highly targeted reports — for example, viewing Sales by Dancer for a specific performer between two dates. 🧩 Additional ControlsAt the top of the report viewer, you’ll find standard viewing tools:
⭐ Best Practices
Related Topics
|